Recent News
Outlook for the Energy Storage Market in the First Half of 2026: More Records on the HorizonInternational Renewable Energy Agency: The electricity costs of renewable energy + energy storage projects are lower than those of fossil fuels, marking a new stage in the energy transition.From the “Industrial Acceleration Act” to the Inverter Ban: Is Energy Storage the Next Target for the EU?Dai Chu Shou Chao Yu Chu Shou: Risks and Opportunities in the German Energy Storage MarketLatest news on international energy storage as of April
Outlook for the Energy Storage Market in the First Half of 2026: More Records on the Horizon
June 1, 2026 News112GW
Global new installed capacity of energy storage (excluding pumped storage) in 2025
158GW
Global projected new installed capacity of energy storage in 2026 (excluding pumped storage)
2.9 TW
Projected cumulative installed capacity of global energy storage (excluding pumped storage) in 2036
In 2025, the global new installed capacity of energy storage will exceed 100 GW, setting a new record high. Despite policy resistance, the annual new installations in China and the United States still achieved growth, demonstrating market resilience. The deployment scale in Australia, Saudi Arabia, and sub-Saharan Africa also showed an increasing trend. As emerging markets accelerate deployment through co-location regulations, bidding, and improvements in the fundamentals of the power market, this industry is expected to continue expanding over the next 10 years.
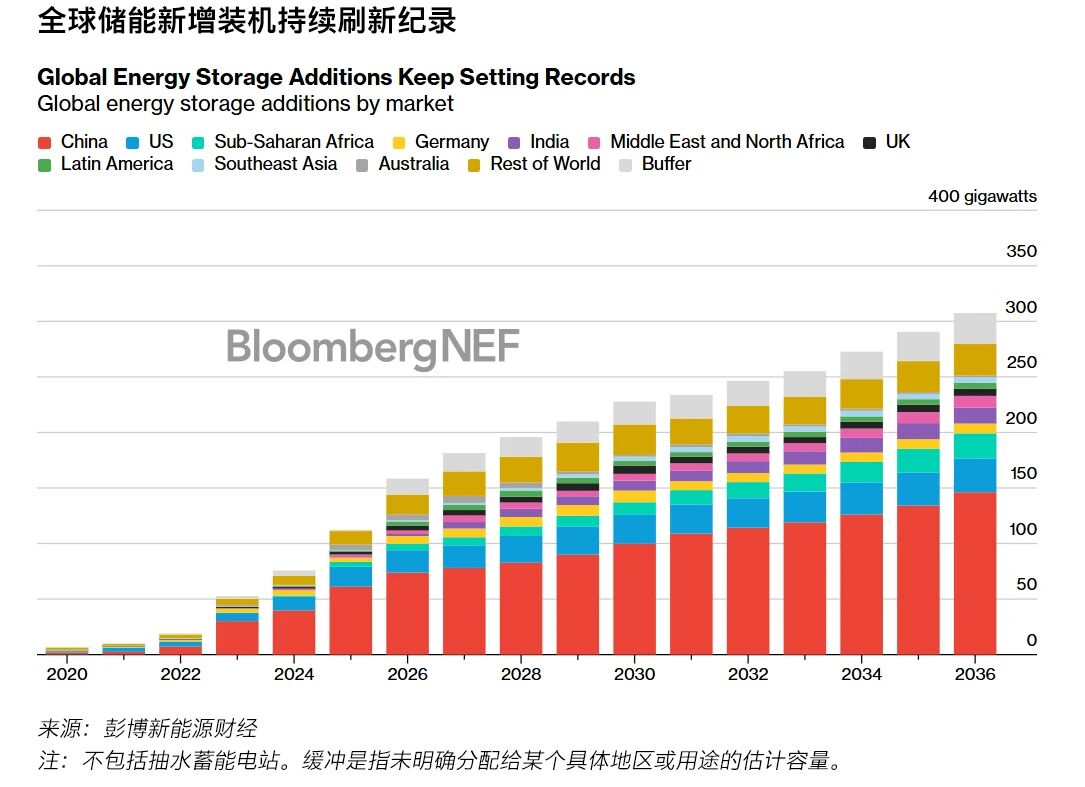
In 2025, the global new installed capacity of energy storage (excluding pumped hydro storage) reached 112 GW/307 GWh, an increase of 48% compared to 2024 (measured in GW or power generation capacity). China and the United States remained the largest markets, accounting for 70% of the annual new installations. Thanks to favorable power market fundamentals and new subsidy programs for residential energy storage, Australia's new installations soared, surpassing Germany and rising to the third position. The new installations in the United Kingdom, Saudi Arabia, and sub-Saharan Africa also reached record highs.
Although the new installations of photovoltaic and wind power have slowed down, Bloomberg New Energy Finance predicts that the new installations of energy storage will soar to 158 GW/459 GWh in 2026, an increase of 41% compared to 2025. In emerging markets such as India, Southeast Asia, and Latin America, driven by mandatory storage for new renewable energy projects, the increase in photovoltaic penetration rate, and often oversubscribed bidding, new installations will also grow. Geopolitical tensions have intensified concerns about energy security, pushing new installations to increase further. By the end of 2036, the cumulative installed capacity will reach 2,867 GW/10,514 GWh, ten times the level in 2025.
Many markets are promoting localization. The United States is leading in this regard, requiring that projects must purchase battery components from markets other than China to be eligible for tax credits. Other markets such as the European Union, Japan, and South Korea have implemented or are considering similar requirements in their bidding processes. In Brazil, projects using locally sourced components can enjoy preferential financing.
As manufacturers in the United States and South Korea reduce production of nickel-based batteries, lithium iron phosphate (LFP) batteries will continue to dominate the market share until 2035. However, as alternative material systems are adopted, their market share will gradually decline over the next 10 years. Unless for long-term lithium energy storage, sodium-ion batteries are also receiving increasing attention as technology suppliers sign supply contracts one after another.
In the newly added installed capacity in 2025, large-scale projects accounted for 85%, mainly for energy time-shifting. Short-term energy storage with a duration of less than six hours accounted for 79% of the total installed capacity for energy time-shifting. Due to the increased application of non-lithium long-term energy storage technologies, this proportion will decrease from 2026 onwards, reaching 57% by 2036. In many markets such as the UK, Italy and Australia, the energy storage duration of lithium-based energy storage has now exceeded 8-10 hours.
In 2025, the Asia-Pacific region will add 68 GW/191 GWh of installed capacity, representing a 60% increase compared to 2024. This growth is mainly attributed to the expansion in China and Australia. Thanks to supportive policies such as bidding schemes and mandatory co-location regulations, which have driven a significant increase in new installations in emerging markets (including India, Japan, South Korea, and Southeast Asia), the Asia-Pacific region will continue to dominate deployment until 2035. By the end of 2035, the cumulative installed capacity in this region will reach 1,379 GW/5,234 GWh, which is 13 times the level in 2025.
In 2025, the Americas region will add 19 GW/62 GWh of installed capacity, representing a 49% increase compared to 2024 (measured in GW). Although other markets such as Canada, Argentina, Brazil, Chile, and Mexico have supported growth through various market conditions such as bidding, flexibility, grid constraints, and evolving regulations, the United States is still likely to maintain its dominant position. By the end of 2035, the installed capacity in the Americas region will reach 359 GW/1,363 GWh, which is seven times the level of 2025.
In 2025, the region of Europe, the Middle East and Africa saw an increase in installed capacity of 23 GW/50 GWh, representing a year-on-year growth of 55% (measured in GW). Saudi Arabia, Africa and smaller markets in Europe drove this growth. Larger European markets including the United Kingdom, Germany and the Iberian Peninsula, as well as emerging markets in the Middle East, are also advancing large-scale project construction through the signing of long-term revenue contracts and co-location with photovoltaic projects.
The Bloomberg New Energy Finance model incorporates a global buffer to address the unpredictability of the market and potential policy benefits that bring uncertainties. The historical adjustments are based on battery shipment analysis, which determines the gap between historical and recent battery demand. Bloomberg New Energy Finance's assumptions for 2023 and 2024 are 5.1 GWh and 12.0 GWh respectively, accounting for 12% and 16% of the demand outside China in these two years (in GWh terms) (excluding the buffer). From 2025 to 2036, Bloomberg New Energy Finance applies a 10% buffer to its annual global installed capacity forecast (in GWh terms).
RELATED POSTS
-

Ningbo Jing Hong Energy Technology Co., Ltd.
Room 205, 2nd Floor, Building 3, No. 128,Jingyuan Road, Ningbo High-tech Zone,Zhejiang ProvinceA Tech Power B.V.
VAT ID: NL865234759B01
Grevelingenhout 45, 4311NL, Bruinisse, the Netherlands
©2023 wpboss.cn, wordpress theme designer